
As Bitcoin is rejected from the critical resistance level, we also see pullbacks in altcoins.
Altcoin Market Cap is trying to hold on to the pink support zone.
Ether’s and SOL’s holding above support levels enabled Altcoin Market Cap to remain strong above support.
The $2,800 level for ETH, the $115 – $116 region for SOL and the $900 – $930 billion support zone for Altcoin Market Cap are of serious importance.
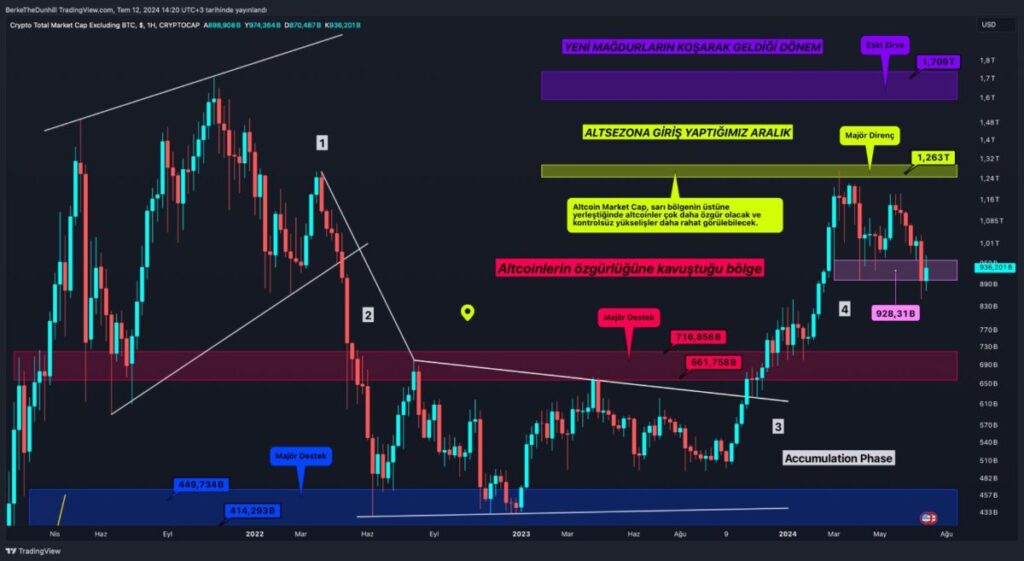
Altcoin Market Cap weekly chart
MAGIC is in the critical zone
MAGIC is a product that rallied in 2023 and early 2024.
Although it rallied in two different periods, there is only one region where buyers mobilise when the sale comes.
This zone is the red zone covering the 40 – 45 cent range. MAGIC touched the red zone again during this period of hard sales in the altcoin market.
MAGIC, which fell to 40 cents at the beginning of July, continues to move above the red zone.
If it can survive the chaotic process above the red major support zone, we can see the pink line (88 cents) after a while.
In the coming period, I expect it to move between the red major support zone and the pink line.
If it experiences a decline where the support will be permanently broken, it is necessary not to be too stubborn with the trend, if it is seen that the pink line is crossed, this time the purple line and green line levels are targeted.
In this sense, the levels of $1.2 and $1.45 may appear as resistance.
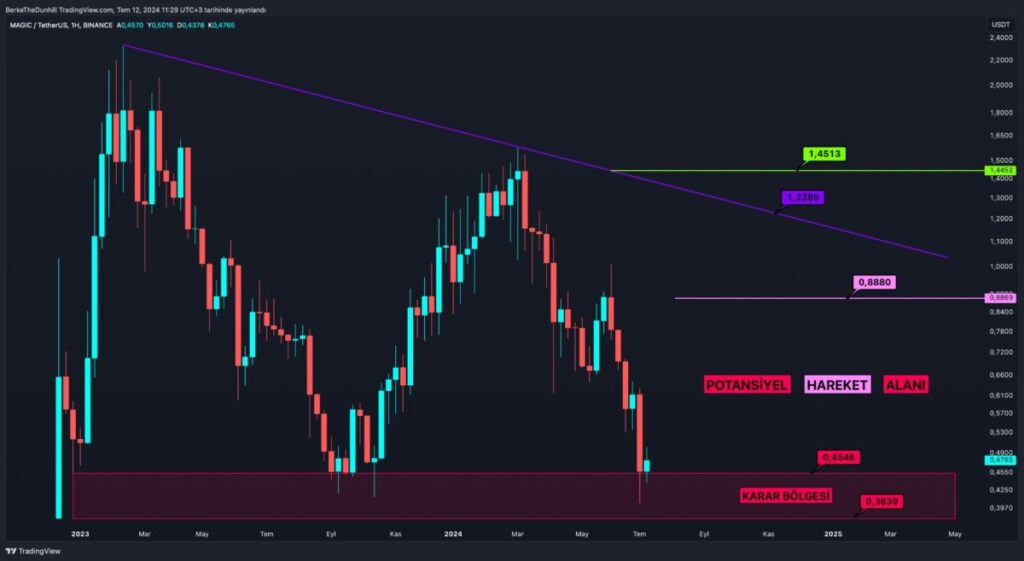
MAGIC/USDT weekly chart
ROSE is one of the altcoins that remain strong
ROSE has been one of the products that have remained relatively strong in recent months.
ROSE, which made a bottom in the green zone during the bear season, is consolidating well above this zone.
The green zone covers the range of 0.033 – 0.043. It entered this zone in three different periods and then started a nice bull run as of 2023 October.
About half a year after October, when it started the run, it reached the blue major resistance zone. In this region, it could not withstand the pressure of sellers and weakness began.
In this chaotic process, it retreated to the pink intermediate support zone and continues to move in this zone. In terms of support, attention should be paid to the range of 0.075 – 0.078.
The loss of this region may be a major obstacle to seeing a very strong ROSE in the short term.
It needs to remain strong in this region so that when the market recovers, at least the blue resistance zone can be tested again.
At this point, of course, whether Bitcoin will pass the $60,000 level in the short term will be an important factor.
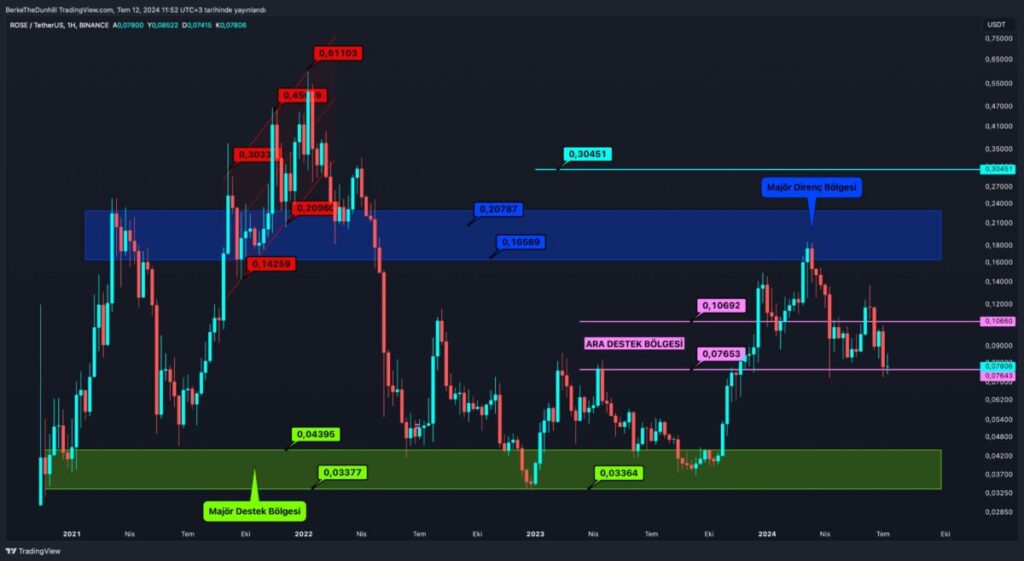
ROSE/USDT weekly chart
AVAX’s first resistance
If we compare it with the overall altcoin market, we can easily call AVAX one of the strong altcoins.
After being suppressed below the yellow zone for a very long time, AVAX managed to break this zone with a strong rally in October – November 2023.
AVAX, which quickly climbed up to the red major resistance zone, started to decline due to the appetite of sellers in this region as expected.
The yellow zone ($20 – $23), which has served as resistance for a very long time, has been acting as support this time for a short time.
Buyers have mobilised in this region for now. AVAX’s chaotic process above this zone may enable it to start a strong bull run again in the near future.
The first important resistance stands out as the $30 – $31 zone.
Investors and speculators should pay attention to this resistance zone ($30 – $31) and the major support zone ($20 – $23).
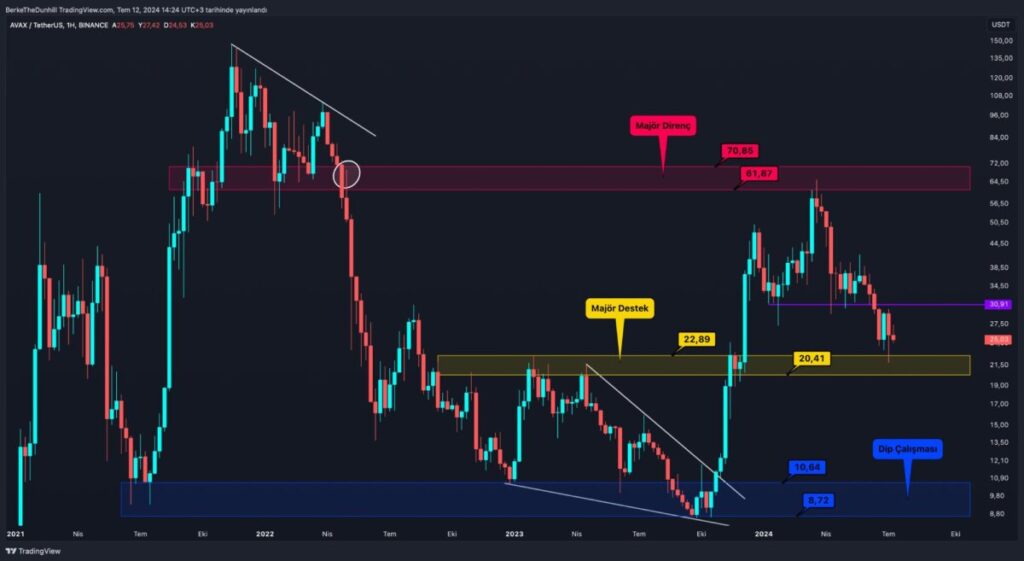
AVAX/USDT weekly chart